
Power BI vs. Tableau

Power BI vs. Tableau
By John Bemis On November 11, 2020 · In Technology
Updated: June 27, 2023
Let’s discuss Business Intelligence tools. Two of the leading tools for data analytics include Power BI and Tableau. They both have very similar capabilities, but do you know what makes them different? Continue reading for the ultimate guide to Power BI vs. Tableau to help determine which data analytics software is best suited for your company.
About Power BI
Power BI is a collection of software services, apps, and connectors that work together to turn your unrelated data sources into coherent, visually immersive, and interactive insights (definition from https://docs.microsoft.com/en-us/power-bi/fundamentals/power-bi-overview). Power BI allows you to easily connect to your data sources to visualize and discover what’s important and easily share these insights across business units and disciplines.
About Tableau
Tableau is a visual analytics platform that transforms the way we use data to solve problems. Tableau’s goal is to improve the flow of analytics and make data more accessible to people through visualization. It’s a user-friendly platform, meaning that any user can easily read and analyze the data it produces through visualizations and reports.
The Similarities of Power BI and Tableau
By definition, both platforms seem very similar. And in some ways, they are. Both are business intelligence tools that create visualizations as a way to analyze data. Both have integration capabilities to an extent and have appealing and user-friendly dashboards. They make data approachable for all users by offering advanced reporting and visualization capabilities.
Any data analytics tool must have that inherent mix of power, ease of use, brand recognition, and price to stay at the forefront. Both of these tools have this, which is why many teams find themselves comparing Microsoft Power BI vs. Tableau when looking for the ideal data analytics tool. Power BI and Tableau are the clear front-runners in business intelligence software, but which is best for your business? Which is better for data science jobs/business intelligence jobs? Let’s dive into the differences.
The Differences
Tableau is built for data analysts. On the other hand, Power BI is better suited to a general audience that needs business intelligence to enhance their analytics. The chart below highlights the key differences between the two business intelligence tools.
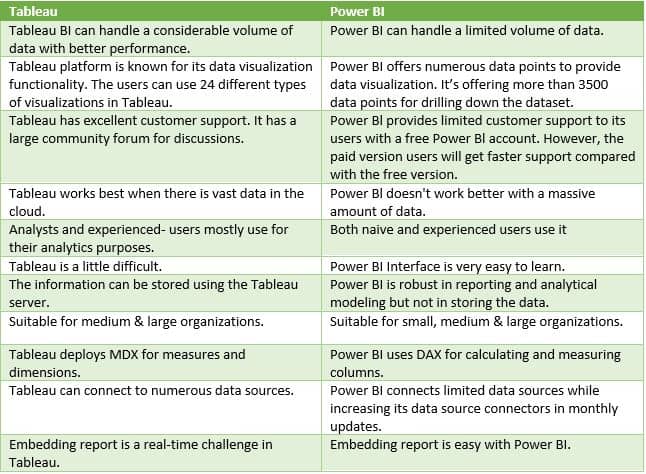
Visualizations
There are key differences between both platforms when it comes to the range of visualizations they offer. Tableau allows users to create a variety of visualizations, including line charts, scatter plots, heat maps, and more. Tableau also provides connections to an unlimited amount of heterogeneous data sources and larger data sets visualizations, whereas Power BI offers a limited amount of data sources. Tableau’s dashboard also provides data basics that can easily be analyzed, downloaded, and applied to other visualizations.
Power BI also focuses heavily on visualizations and allows it’s users to choose from several visualizations and blueprints. From there, users are able to insert data from a sidebar on the dashboard into the visualization. The order in which visuals are created from the data is the most significant difference between Power BI and Tableau. Power BI produces the visuals first and then provides the data to drag in later. Tableau provides the data selection first and then allows the user to switch data between visuals later on.
Data Sources
Power BI has limited access to other databases and servers, whereas Tableau has access to numerous databases and servers. Tableau offers better support when connecting to specific data sources. Power BI is heavily integrated with specific data sources, which is far less than Tableau’s capabilities. Tableau is great when there is a vast amount of data in the cloud, whereas Power BI doesn’t support a lot of data. Power BI does, however, increase its data source connectors in monthly updates. Tableau has a wide array of data source capabilities, and is generally considered more suitable for mid-to-large-sized organizations. While Power BI is ideal for smaller organizations.
Set-Up
Let’s discuss the set-up of each tool. When determining which platform is better suited for your organization, it’s important to have a solid understanding of integration and adoption before reaching a conclusion. Power BI comes in three forms: desktop, mobile, and service. Depending on your organization’s needs, you may need one or all of these services to build and publish your data visualizations. The basic set up of Azure tenant is recommended. This connects to your Power BI through an Office365 Admin interface. Power BI is easy to learn and use, allowing you to quickly connect your existing spreadsheets, apps, and data sources.
With Tableau, you can set up your initial instance through their free trial, allowing full access to every part of the tool. Once in the dashboard, you’ll find a list of all of your available connections. From here, you can begin connecting your data sources and building a worksheet for your visualizations. If you create your data visualization in Tableau Desktop, you can share them easily with your team via the Tableau Server or Tableau Online.
Dashboards
The dashboard of Power BI looks like this:
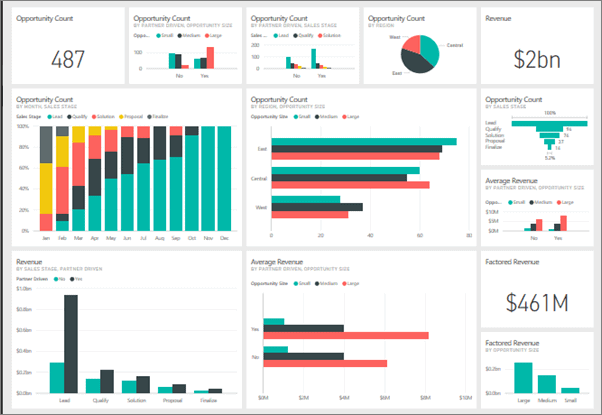
It consists of real-time data access and easy to use drag and drop features. Therefore, Power BI is great for first-time or inexperienced users. It speeds up time to visualizations with easy access to data analytics. Live data access is one of the benefits of this tool, allowing teams to receive information real time and react quickly to business changes.
The Tableau dashboard is as followed:

Tableau’s features are just as strong as Power BI’s, however, they’re not as straight forward. Power BI shows all features directly on its dashboard while Tableau hides some of its features in menus. However, this tool offers a drag and drop table view to ask questions of the data. You just need to drag and drop your data types in the X and Y axis, and Tableau does the rest of the work by instantly building your visualization of choice. The Tableau UX is not as friendly as Power BI’s. Tableau is better for users that are more familiar with data sets and experienced in data analytics.
Price
When choosing the best data analytic platform for your company, it’s important to look at price as well as the overall capabilities of the platform. Power BI is currently less expensive than Tableau. And Power BI offers a free version, a monthly subscription, and a premium version. Power BI uses the existing Microsoft systems like Azure, SQL, and Excel to build data visualizations that don’t break the bank. This is an excellent choice for those who already work within the Microsoft products like Azure, Office 365, and Excel. It’s also a relatively good low-price option for SMBs and startups that need data visualization but don’t have a lot of extra capital.
Tableau’s pricing is different as it only offers a subscription model for purchasing. When buying Tableau, you have the option to choose your hosting options and the number of licenses you need. The higher the price, the more capabilities you receive. It’s also a little more costly because you need to pay more when connecting to third party applications.
Both business intelligence tools have their strengths and weaknesses. Tableau offers more considerable integration opportunities, but Power BI may be a better solution suited for smaller businesses. The tool you choose depends on your business size and needs.
For those of you in data science jobs/business intelligence jobs, which BI tool do you prefer?
About Benchmark IT –Technology Talent
Benchmark IT offers technology consulting, executive search, and direct hire recruitment and staffing services. We service a wide range of clients and industries throughout the metro New York area and beyond. Our proprietary recruitment process and dedication to precision, ethics, and personalized service sets us apart from other recruiting firms. As a result, Benchmark IT has become a trusted partner among Fortune-ranked companies, mid-market, start-up, and growth-phase firms since 2007. For additional information, visit: www.bmarkits.com.
TAGGED WITH → Technology·Analytics